Chicago Car Crash Analysis - Project 2-20
Exploration Questions and Project Topic Choice
We chose to focus on data for car crashes in Chicago across a series of four days in October - October 17th/18th of 2023, and October 31st/November 1st of 2022. Chicago has ample data on this topic, and we wanted to choose a topic whose results would offer social benefits. With more information about the nature of car crashes in Chicago, both in regular times (Oct. 17th/18th) and "busy" times (Oct.31st), Chicago drivers could be more informed on the types of situations that often lead to accidents. Drivers, pedestrians, and policymakers could use our results to create a city that is safer for drivers. Given this social motivation, we focused on the following exploration questions in our project:
1. How does the rate of car crashes differ between men and women?
2. Is there a specific model of car that is involved in most crashes, or a specific model of car that is involved in the least amount of crashes?
3. What is the most common maneuver for getting in a car crash?
4. Is there a specific area of Chicago that has more car crashes than other areas?
5. Is there a specific state license plate that is more common for car crashes than another state’s license plate?
6. How often do crashes lead to injuries?
7. How often do crashes lead to fatalities?
Data Sources
Link: https://data.cityofchicago.org/Transportation/Traffic-Crashes-Crashes/85ca-t3if
We are using three datasets from the City of Chicago Data Portal. These datasets all revolve around car crash incidents. One dataset provides information about the vehicle involved in the crash. One dataset provides information about the victims of the car crash. The third dataset provides information about the location of the crashes. Due to the constraints of Google Colab, we limited the data to between 12 am on October 31, 2022 and 11:45 pm on November 1, 2022. We also took data from 12 am on October 17, 2023 to 11:45 pm on October 18, 2023. We wanted a sample from another day so we could see if there were a particularly large number of car crashes on Halloween.
Data Journey and Caveats
Originally we started out by limiting the dataset to the month of October 2023. However, after attempting to upload it all into a Google Colab file we realized that was unfeasible. We then thought about if there were any significant days we wanted to study, and the first one that came to mind was Halloween. This limited the dataset to one day which was much more manageable. We chose to use three different datasets because we felt that it captured the most information about car crashes in Chicago. If we had just stuck to one dataset, we would have gotten an incomplete picture about car crashes in Chicago. We used an API to get the JSON data from the website. The JSON data was in a list format, so we processed it into differentiated lists that sorted the different categories within the data. We then sorted some of the data into dictionaries to make it easier to count instances of certain data points. We then translated all the data into DataFrames to make visualizations. We do recognize that it is unorthodox to work with three different datasets, but because they are all from the same larger dataset and are all from the same timeframe, we feel confident that they can be effectively compared to each other.
About Us
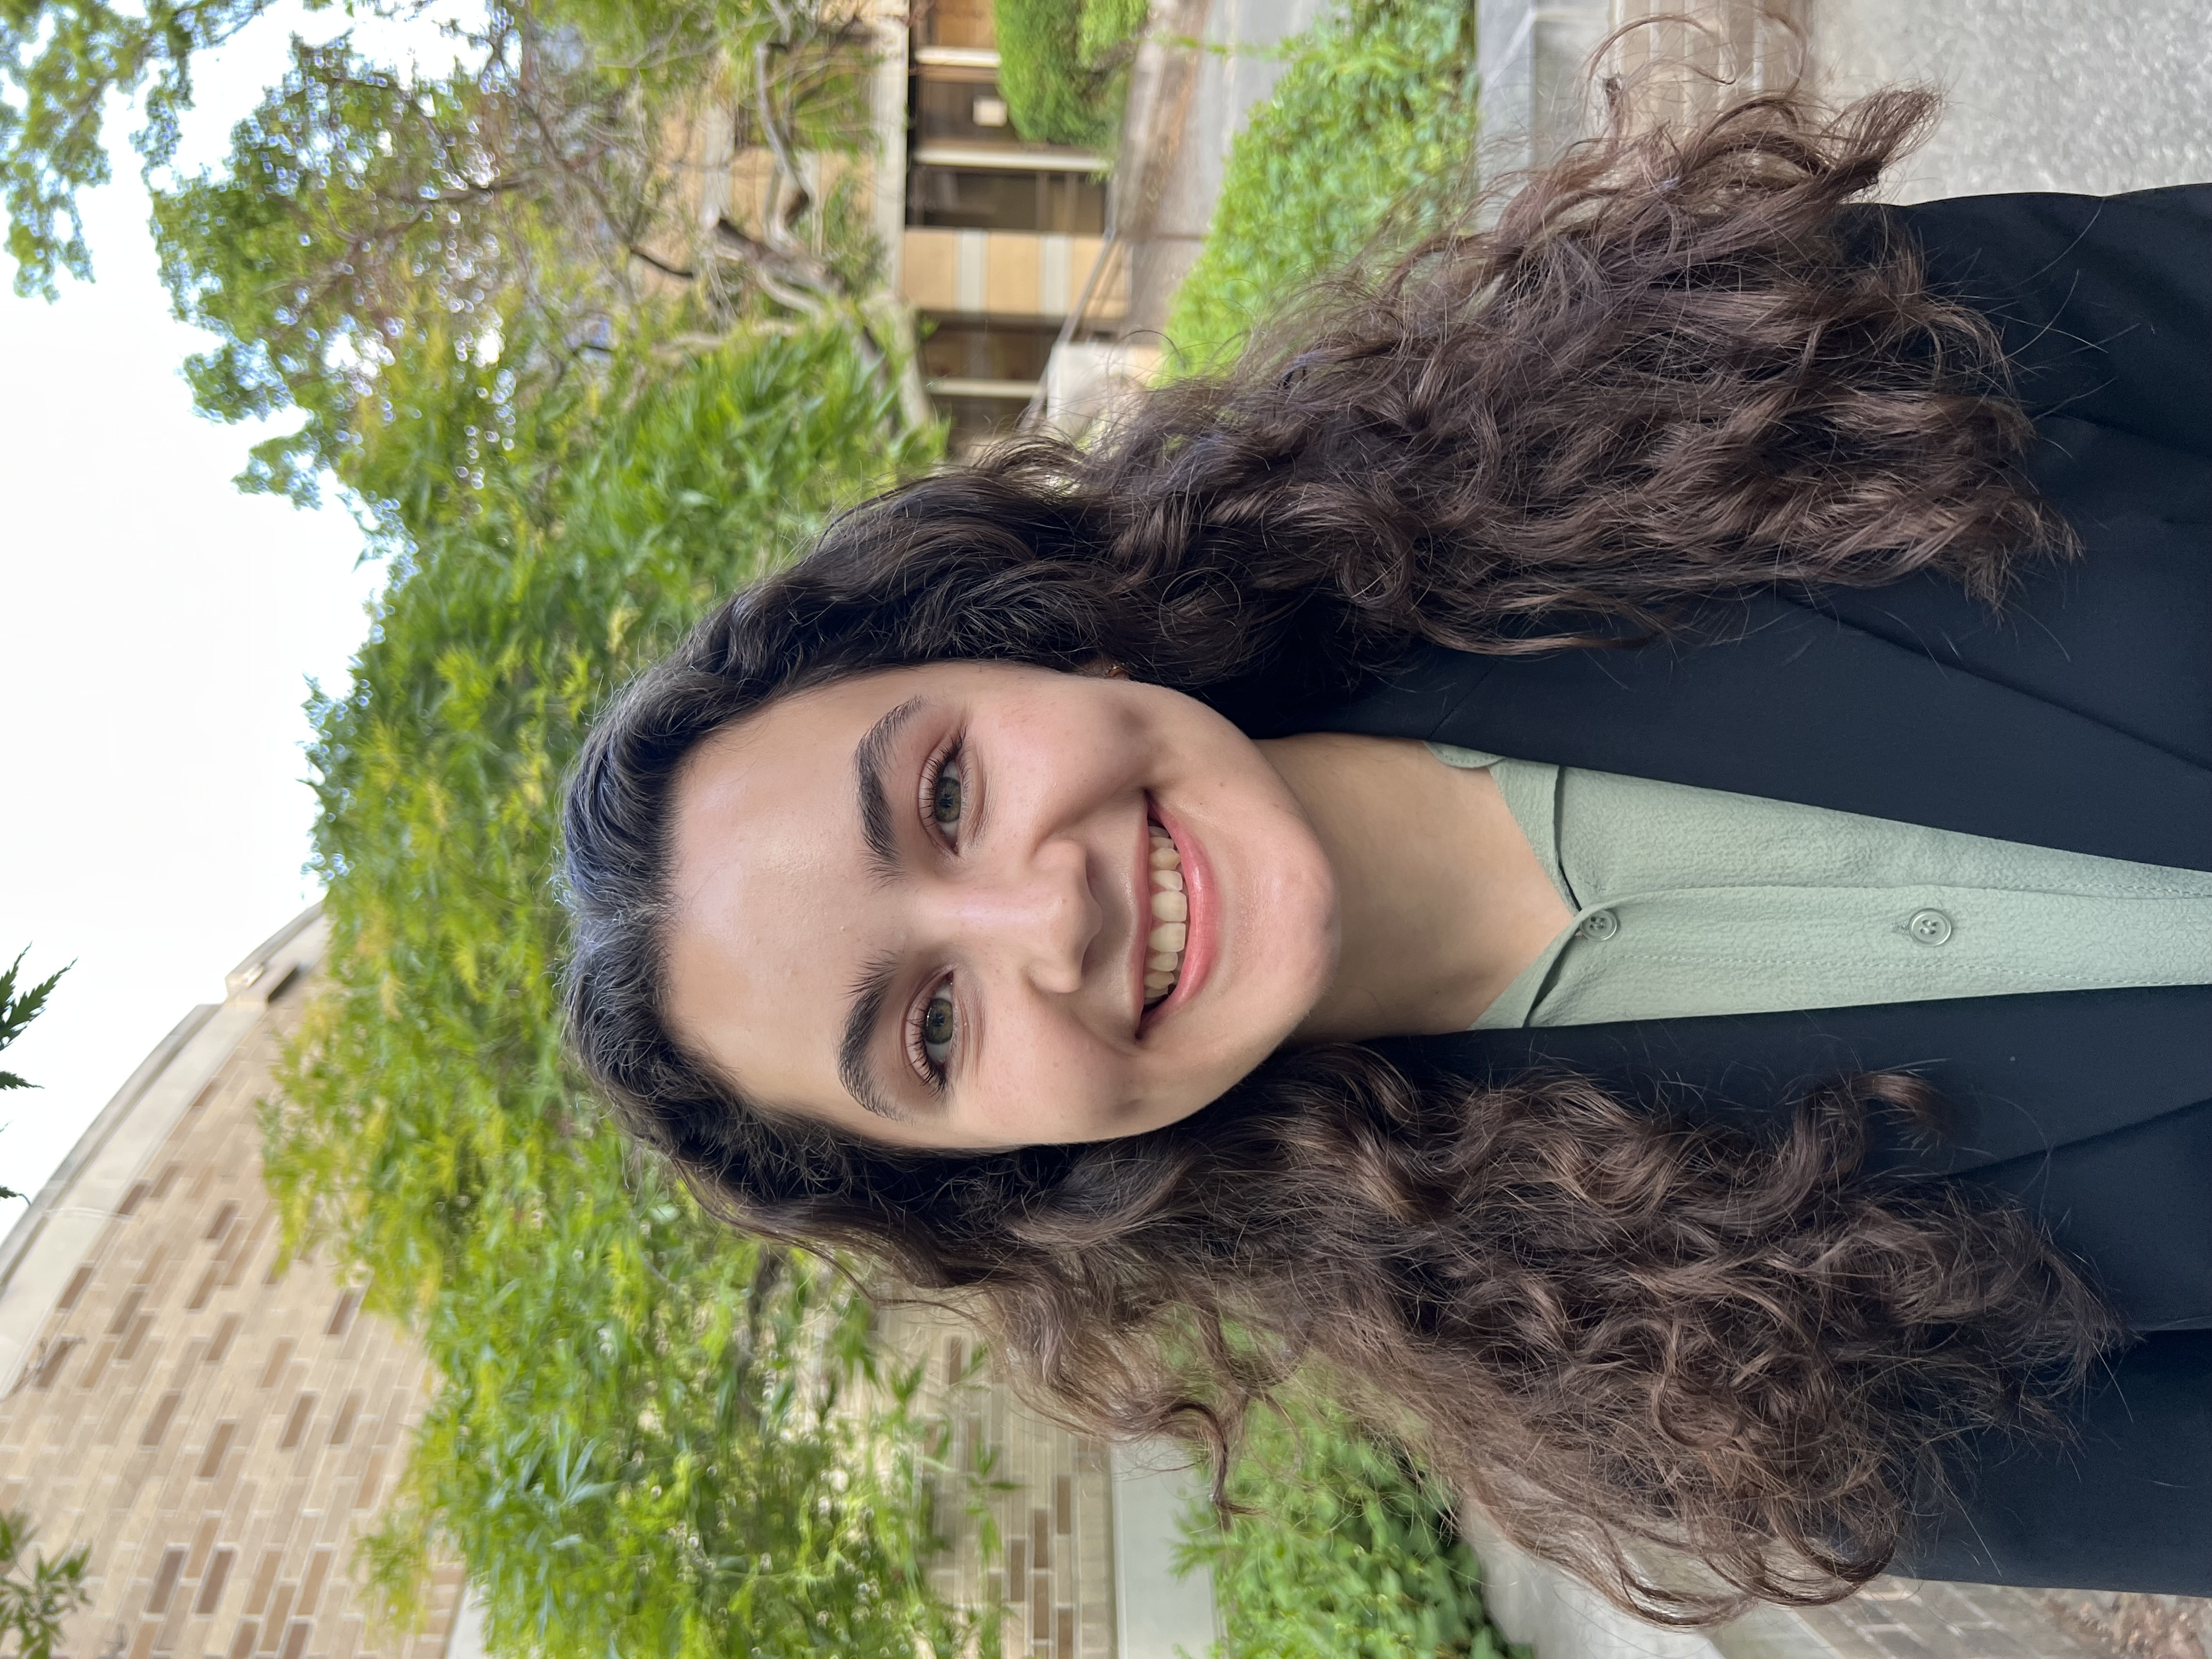
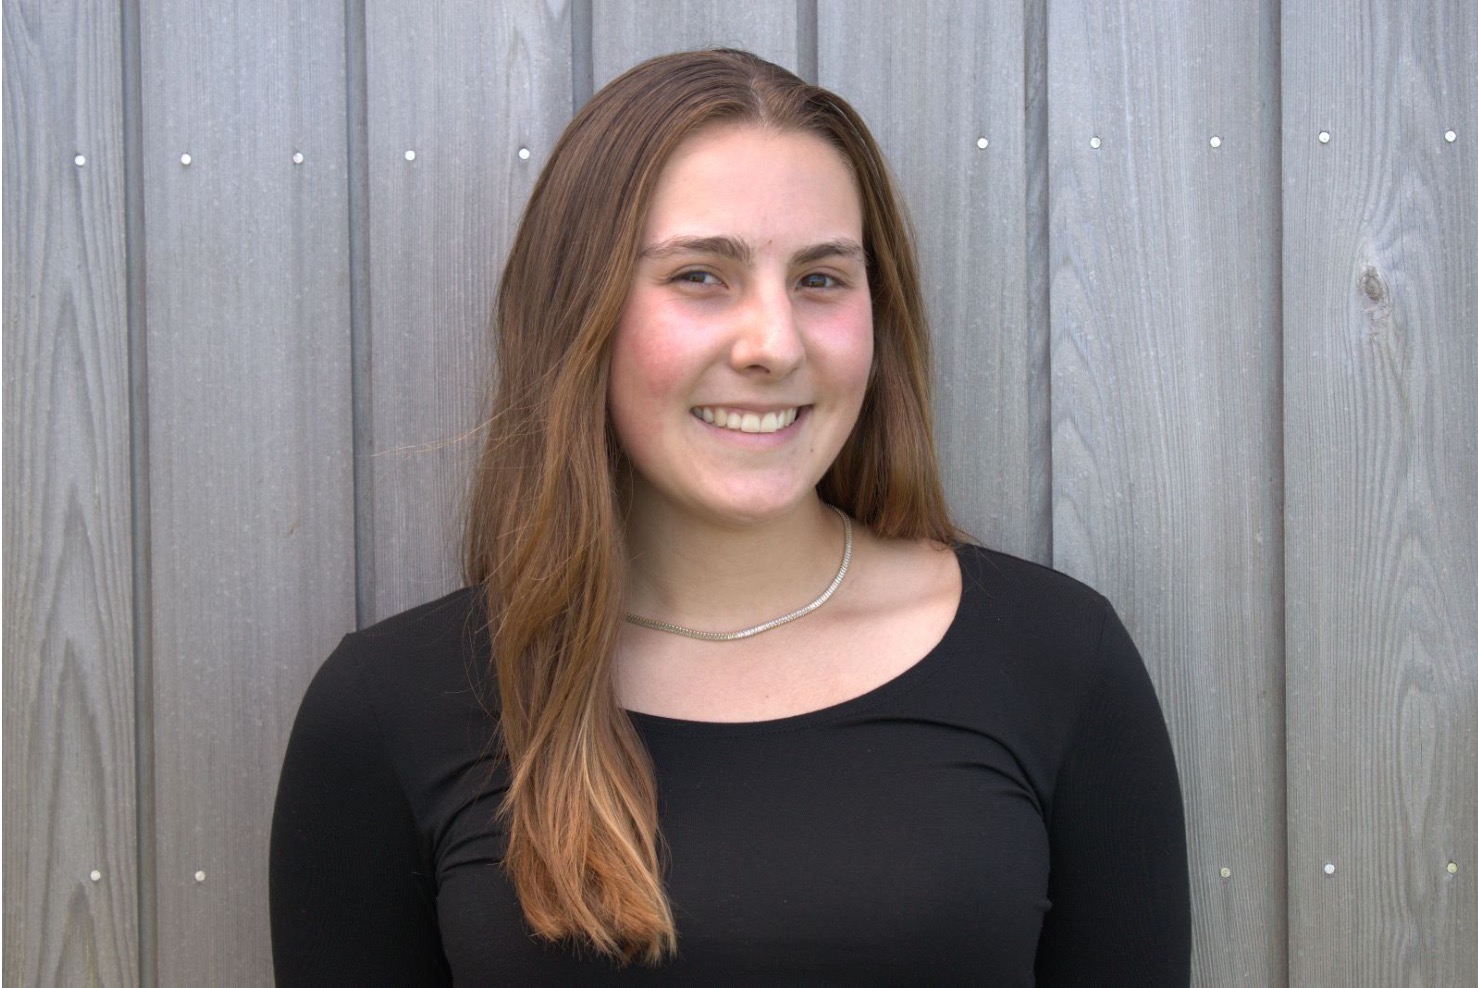
Halle Keane is a junior majoring in Economics and Spanish. She is originally from Avon, CT, but she lives in Pasquerilla East Hall on campus. In her free time, Halle plays clarinet in the marching band and guitar in the pit for musicals across campus.


Cora Eaton is a senior majoring in Political Science and minoring in Chinese. She is originally from Falls Church, VA. She lived in Breen Phillips Hall while she was on campus, and now she lives off campus. In her free time, Cora likes to read, hang out with her friends, and try new recipes in her apartment kitchen.